
AI can spot early disease risk from data you may already track. In the studies here, models using wearables, lab results, and health records often beat standard risk scores for heart disease, diabetes, COPD, and kidney disease.
Here’s the short version:
- Chronic disease is common: about 129 million Americans live with at least one major chronic condition.
- The cost is huge: these conditions account for about 90% of the nation’s $4.9 trillion in yearly healthcare spending.
- The best models use patterns over time: not one blood pressure reading, but trends in heart rate, sleep, glucose, activity, oxygen levels, and lab values.
- Different diseases need different signals:
- heart risk: PPG, ECG, heart rate, HRV
- diabetes risk: CGM, HbA1c, glucose variability
- COPD risk: SpO₂, breathing data, activity, symptoms
- kidney disease risk: creatinine, eGFR, BUN, urine markers
- Top study results were strong:
- AF detection from PPG reached AUC 0.983
- hypertension screening from wrist PPG reached ROC AUC 86.5%
- COPD flare prediction hit 92.1% accuracy
- CKD models reached AUC 0.9689
- But there’s a catch: many models still have weak outside testing, and results often drop in older adults, minority groups, and messy device data.
In other words, if you want the plain answer: AI is best at finding early warning signs when it reads mixed biometric data over time, but most tools are still better viewed as risk alerts than final medical answers.
What I take from this article is simple: the promise is clear, but the gap between study results and day-to-day care is still there. The main value today is helping you and your care team notice changes sooner, not replacing diagnosis or clinician judgment. Instead, these tools help in setting biometric benchmarks to track your health journey more precisely.
2. Biometric Signals and AI Methods Used in Risk Prediction
Key biometric inputs: heart, metabolic, respiratory, and lab data
The best biometric signals depend on the disease being predicted. AI tends to work best when it follows the earliest condition-specific changes, not just broad markers of health. Put simply, the job is to match each signal to the condition it can flag first.
For cardiovascular risk, the most useful inputs are photoplethysmography (PPG) from wrist wearables, electrocardiogram (ECG) waveforms, heart rate, and heart rate variability (HRV). In one ischemic heart disease screening study, PPG wearables and HRV features, including high-frequency and low-frequency components, reached about 90% accuracy and aligned closely with Holter ECG results.[3][7] That matters because PPG is already built into many wrist-worn devices, which makes it a practical signal for early screening.
For metabolic risk, especially diabetes and prediabetes, continuous glucose monitoring (CGM) is now a major input. CGM records glucose values every few minutes, and AI models trained on these streams can predict glucose levels up to 60 minutes ahead in people with normoglycemia, prediabetes, or type 2 diabetes.[9][12] These models also use measures such as time in range, glucose variability, HbA1c, and diabetes duration to track patterns over time.[5][8]
Respiratory risk models often rely on spirometry, especially FEV1, FVC, and the FEV1/FVC ratio, along with overnight SpO₂, breathing rate, and sleep fragmentation. For CKD, the core inputs are serum creatinine, eGFR, blood urea nitrogen (BUN), and albumin-to-creatinine ratio. These are usually pulled from structured EHR records, together with diagnosis codes, medication lists, and blood pressure readings.[10][14]
Recent studies are starting to mix wearables, lab results, EHR history, and lifestyle data in the same model. That combination often works better than any single input alone, especially in multimodal systems. It’s a bit like putting together a puzzle: one piece helps, but several pieces show the picture more clearly.
AI model types used in recent studies
Model choice depends on the type of data being used.
For structured tabular data, such as labs, vitals, demographics, and EHR fields, tree-based models show up most often. Logistic regression is commonly used as a baseline because it is easy to interpret. Random forest and gradient boosting models, including XGBoost and LightGBM, often beat it on accuracy. In comparative studies, gradient boosting models reported AUC values around 0.83 to 0.90 for diabetes and CKD prediction.[4][8] One EHR study compared tree-based models with logistic regression and AdaBoost.[13]
For waveform and time-series data, such as CGM glucose curves, PPG streams, spirograms, and continuous heart-rate signals, researchers tend to use CNNs, RNNs, and transformer-based models instead. These models can pick up patterns in how data changes over time, not just in summary numbers. Transformers, in particular, are gaining traction for wearable and spirometry time series because they can learn from long-range patterns in sequential data.[11][6]
Across both groups, researchers often pair high-performing models with SHAP (SHapley Additive exPlanations) to show which signals are driving each prediction. In PPG-based cardiac studies, SHAP analyses identified frequency-domain HRV features, especially high-frequency (HF) and low-frequency (LF) power, as the main contributors to risk scores. That points to autonomic imbalance as an early warning sign.[3][7] In CGM-based models, SHAP highlighted time in range and glucose variability as the strongest predictors of diabetic complications.[5][8]
These tools help show what is behind each risk score, which makes the output easier to understand before comparing disease-specific results in the next section.
sbb-itb-f5765c6
AI May Accurately Predict Kidney Failure Risk in Chronic Kidney Disease Patients
3. What Recent Studies Show for Major Chronic Diseases
AI vs. Standard Risk Scores: Chronic Disease Prediction Performance
Building on the signals and models above, these studies show where AI performs best by disease.
Hypertension and cardiovascular risk
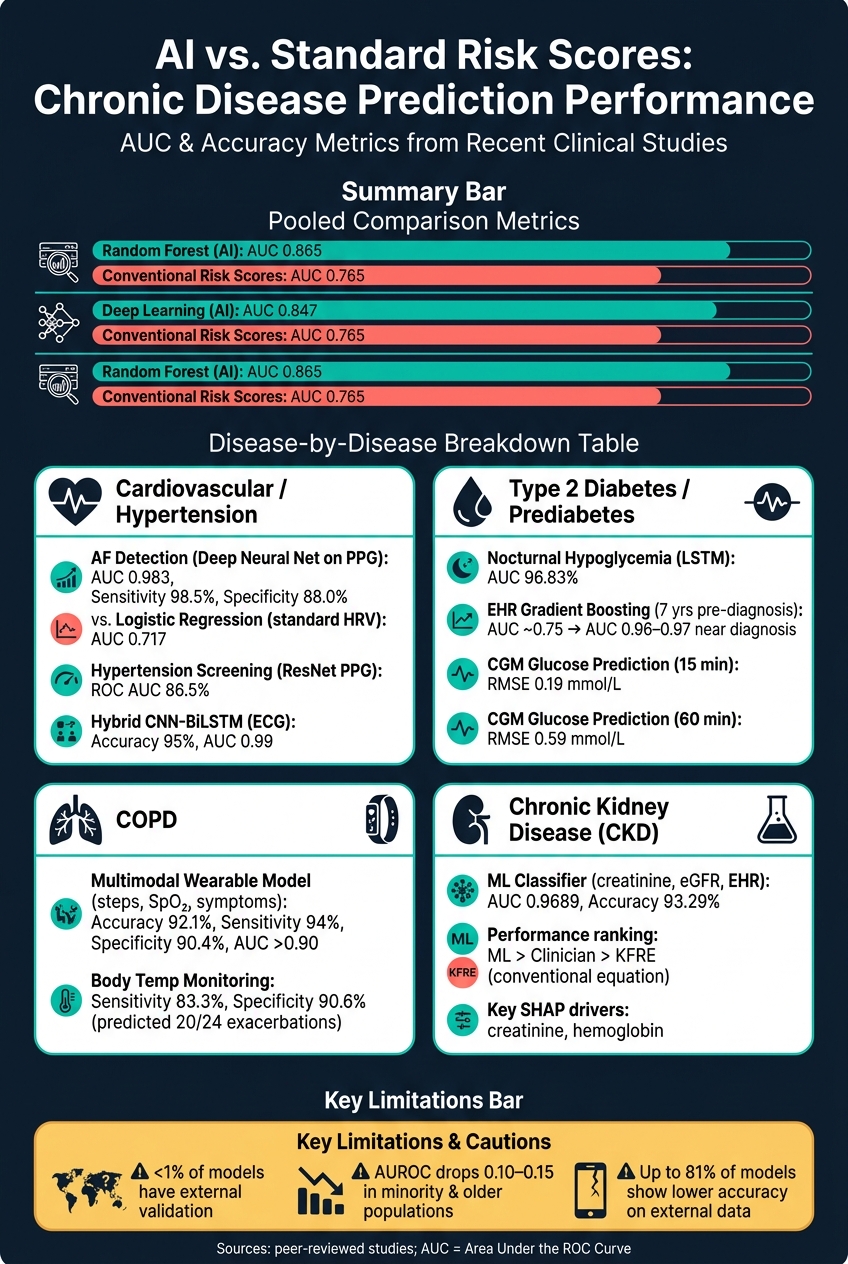
In hypertension and cardiovascular risk, ResNet-based PPG and ECG models already post strong screening results. A ResNet-based wrist PPG model for hypertension risk screening reached a ROC AUC of 86.5% and a PR AUC of 83%.[35] For continuous blood pressure estimation, deep CNN and transfer-learning models using combined PPG and ECG inputs achieved grade A under the British Hypertension Society protocol and met AAMI criteria for systolic, diastolic, and mean blood pressure.[32]
Atrial fibrillation detection is one of the clearest bright spots. A deep neural network trained on raw PPG achieved an AUC of 0.983, sensitivity of 98.5%, and specificity of 88.0% - compared with an AUC of 0.717 for logistic regression using standard HRV features on the same signal.[31] A hybrid CNN-BiLSTM classifier applied to ECG reached 95% accuracy and AUC 0.99,[34] and a meta-analysis of deep learning AF detection from ECG reported pooled AUC of 1.00, with sensitivity and specificity around 97% to 98%.[33] In plain terms, models trained on raw waveforms usually beat feature-engineered arrhythmia classifiers.
Cardiovascular studies lean most on waveforms. Metabolic studies, by contrast, rely more on CGM and routine lab data.
Type 2 diabetes, prediabetes, COPD, and chronic kidney disease
For glucose prediction, CGM-based models performed well at short time horizons. They predicted glucose 15 minutes ahead with an RMSE of 0.19 mmol/L (about 3.4 mg/dL) overall, rising to 0.29 mmol/L (about 5.2 mg/dL) in people with type 2 diabetes. At 60 minutes, the RMSE was 0.59 mmol/L (about 10.6 mg/dL).[12][9] For nocturnal hypoglycemia risk, a deep LSTM model achieved an AUC of 96.83% in type 2 diabetes, beating both SVM and random forest.[25] EHR-based gradient boosting models can also predict incident type 2 diabetes years before clinical diagnosis, with AUC rising from around 0.75 at seven years pre-diagnosis to about 0.96–0.97 as diagnosis gets closer.[26][27]
COPD exacerbation prediction is a good example of what multimodal wearable data can do when several signals move together. A supervised model integrating daily steps, stairs climbed, distance moved, SpO₂, and symptom logs predicted acute exacerbations within 7 days with 92.1% accuracy, 94% sensitivity, and 90.4% specificity, with AUC above 0.90.[20][21] Continuous wearable body temperature monitoring adds another useful input. One study predicted 20 of 24 clinically diagnosed exacerbations, with sensitivity of 83.3% and specificity of 90.6%, based on temperature changes in the preceding week.[23]
For chronic kidney disease, models built on creatinine, eGFR, and EHR features outperform older risk equations. One ML classifier achieved an AUC of 0.9689 and 93.29% accuracy,[24] while another analysis found performance ordered KFRE < clinician < ML.[19] Explainability often points to creatinine and hemoglobin, which helps clinicians make sense of the output.[28][29][30]
Overall patterns across the evidence
Three patterns stand out.
- Multimodal inputs - combining wearables, labs, and EHR history - almost always outperform single-signal models.
- Longitudinal data matters more than snapshots. Continuous or daily streams let models catch trends and variability before clinical events.
- Performance depends heavily on data quality and validation rigor. Models trained on small or narrowly defined cohorts can look strong in internal testing but fall apart when used elsewhere.
The strongest results usually come from short-horizon predictions backed by dense, high-quality data.[16][17][18][19][22][24]
These results show where AI is strongest today; the next section covers the limits that still constrain daily use.
4. Clinical Value, Limits, and What This Means for Daily Health Tracking
How AI risk prediction can support daily monitoring
Those short-horizon gains only matter if they help in day-to-day tracking. In practice, blood pressure, HRV, sleep, and glucose are more useful when you look at them together over time, not as separate one-off readings.[15]
One LSTM-based continuous monitoring framework built with consumer wearables reached 93.7% accuracy in predicting health events up to five days in advance. That beat random forest at 91.5%, XGBoost at 90.6%, and a simple rule-based threshold method at 78.6%.[1] In the same framework, SHAP analysis showed that recent heart-rate trends, HRV, and low activity carried the most weight. That’s a good reminder that wearable data can say a lot when you model it as a time series instead of reading each metric on its own.[1]
Limits researchers keep reporting
The gap between strong results in papers and what happens in daily use is still large. Fewer than 1% of models went through external validation, and many studies left out sensitivity or specificity.[40]
Once models are tested outside the dataset they were built on, performance often slips. Researchers have documented AUROC drops of 0.10–0.15 in minority and older populations, and lower accuracy in up to 81% of models checked on external data.[2][37] Wearables add another layer of trouble: motion artifacts, non-wear periods, device switching, and missing readings can all drag down performance in ways neat research datasets don’t show.[38][39]
Put simply, the main problems are still the same:
- weak external validation
- noisy wearable data
- worse performance across subgroups
Because of that, risk probability estimates should be treated as directional signals, not clinical verdicts, until models are tested prospectively across diverse U.S. populations.
That space between research performance and daily use is where action-focused coaching can help most.
How Healify fits this research direction
Healify follows that same contextual data models and uses it to turn tracking data into next steps. By combining wearables, biometrics, bloodwork, and lifestyle data in one place, Healify's AI coach Anna translates those risk signals into plain-language guidance - whether that means adjusting activity, shifting sleep timing, or prompting a clinician follow-up.[15][36]
5. Conclusion: What to Watch as AI Risk Prediction Moves Forward
Taken together, these studies show what biometric monitoring can do when AI looks at patterns over time instead of isolated readings. Across cardiovascular disease, type 2 diabetes, COPD, and chronic kidney disease, AI models that use multimodal biometric data spot risk earlier than standard scores, with pooled AUCs of 0.865 for random forest and 0.847 for deep learning, versus about 0.765 for conventional risk scores.[42]
That said, there’s still a gap between strong study results and day-to-day clinical use. Most models still don’t have independent external validation. So the big test isn’t just model accuracy on paper. It’s whether these systems hold up when used in new settings, with new patient groups, and inside actual care workflows.
Over the next 3 to 5 years, watch for FDA clearances, EHR integration, explainable AI, and testing across racial, ethnic, and socioeconomic groups. Those are the steps that move these tools from research performance to day-to-day monitoring in clinics and health systems.[41][2][43]
Used well, AI works best as an early-warning tool. It can turn heart rate, sleep, activity, and bloodwork into signals a care team can act on, while still leaning on guideline-based screening and clinician judgment. The raw data is already there. AI is getting better at reading those signals sooner.
FAQs
How accurate is AI for disease risk prediction?
AI can predict disease risk with a high degree of accuracy when it’s trained on the right biometric data and tailored to a person’s baseline.
One Healify summary reports sepsis prediction 6 hours earlier at 83% accuracy and stroke detection in under 4 minutes at 97% accuracy. That’s a big deal. In plain terms, the system isn’t just spotting trouble fast; it’s doing so early enough to give care teams more time to act.
Results can get even better when AI pulls from more than one source. For example, pairing wearable data with lab results and EHR data gives the model a better read on what’s normal, what’s changing, and what may need attention. If those models are updated on a regular basis, performance can improve further as new patient data comes in.
What health data helps AI predict chronic disease risk?
AI can estimate chronic disease risk by pulling health data into a long-term profile.
That profile can include:
- Wearable data like heart rate, blood pressure, heart rate variability, oxygen saturation, activity, and continuous glucose monitoring
- Sleep, breathing, and brain activity
- Clinical data such as EHRs, lab results, medication history, and medical imaging
- Lifestyle, genetic data, and manual inputs like mood or nutrition
Healify helps iPhone users make sense of all that information with personalized guidance and actionable insights.
Can AI risk scores replace a doctor’s diagnosis?
No. AI risk scores do not replace a doctor’s diagnosis.
They can review biometric data, spot patterns, and flag early warning signs, but they are not diagnostic tools. They work best alongside clinical assessments and can help shape conversations with your healthcare provider. A doctor is still needed to confirm a diagnosis and decide on treatment.