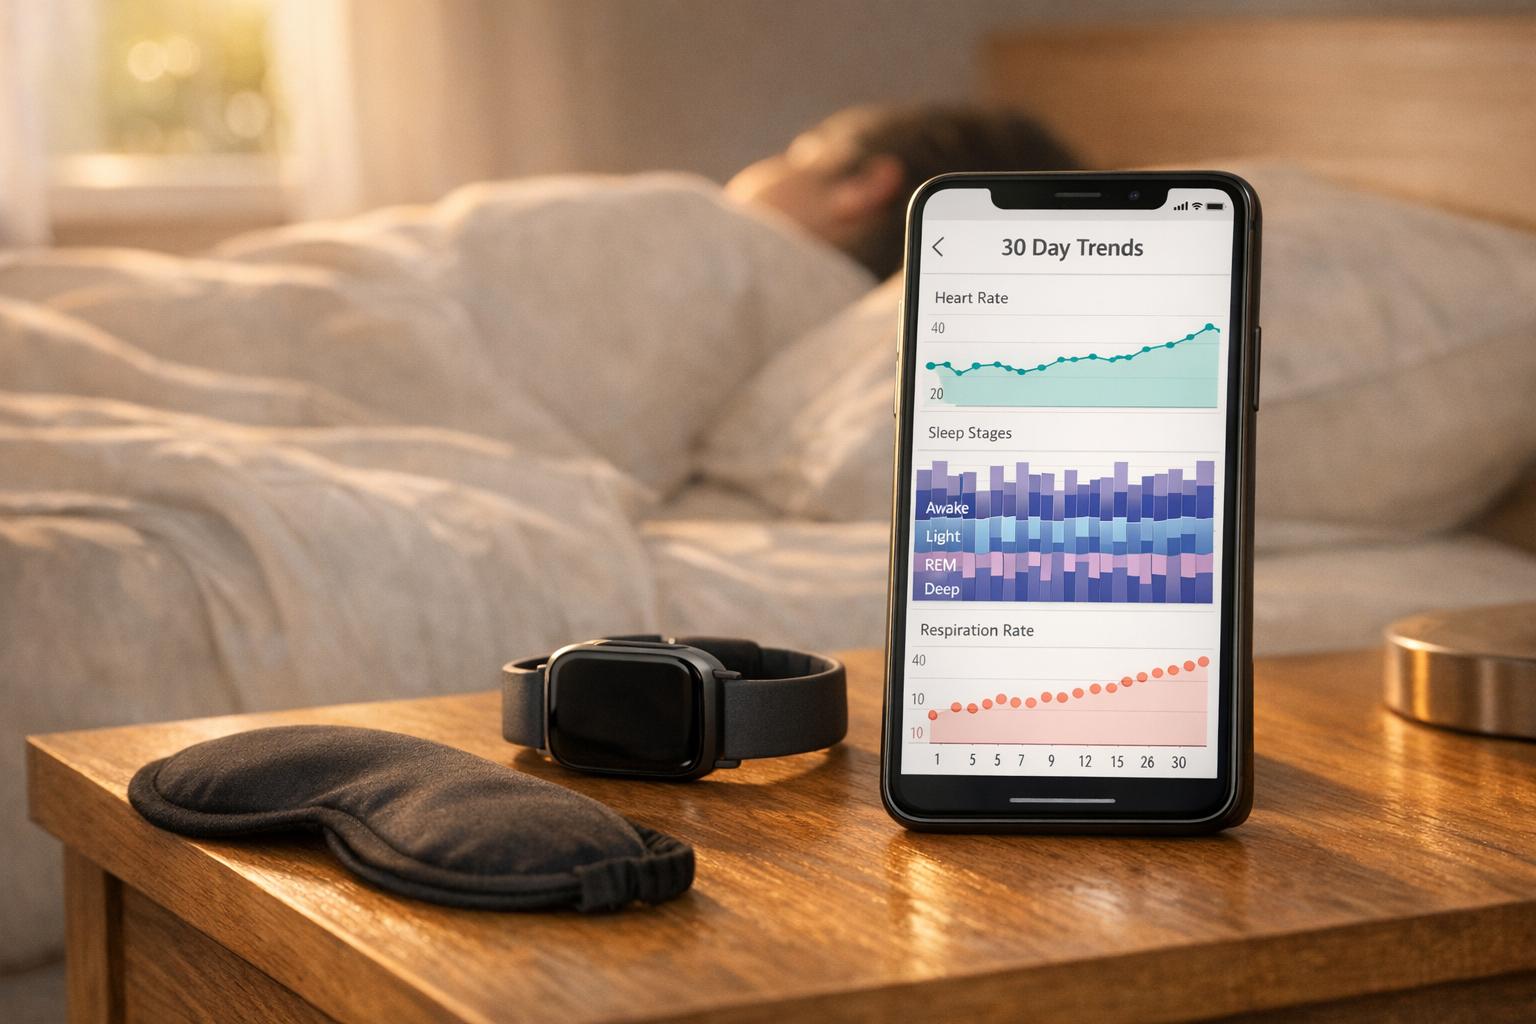
Your wearable device is more than just a step counter - it’s a window into your long-term health. By tracking metrics like HRV, sleep stages, and stress markers over weeks or months, you can uncover personal patterns that single measurements often miss. Here’s what you need to know:
- Stress and Sleep Are Linked: A Harvard study showed 92% of participants had a connection between stress and sleep, though how they influenced each other varied by individual.
- Tracking Over Time Matters: Wearables reveal trends like sleep irregularity, which has been tied to higher risks of obesity, hypertension, and depression.
- Key Metrics to Watch: HRV, deep sleep, REM sleep, respiratory rate, and resting heart rate can signal stress, recovery, or potential health issues.
- Actionable Insights: Consistent monitoring helps you identify triggers (e.g., poor sleep after stressful days) and adjust habits to improve well-being.
Wearable data isn’t just about numbers - it’s about understanding how your body responds to life’s demands. By analyzing trends and making small changes, you can boost recovery, manage stress better, and improve your health over time.
Key Wearable Metrics for Tracking Stress and Sleep
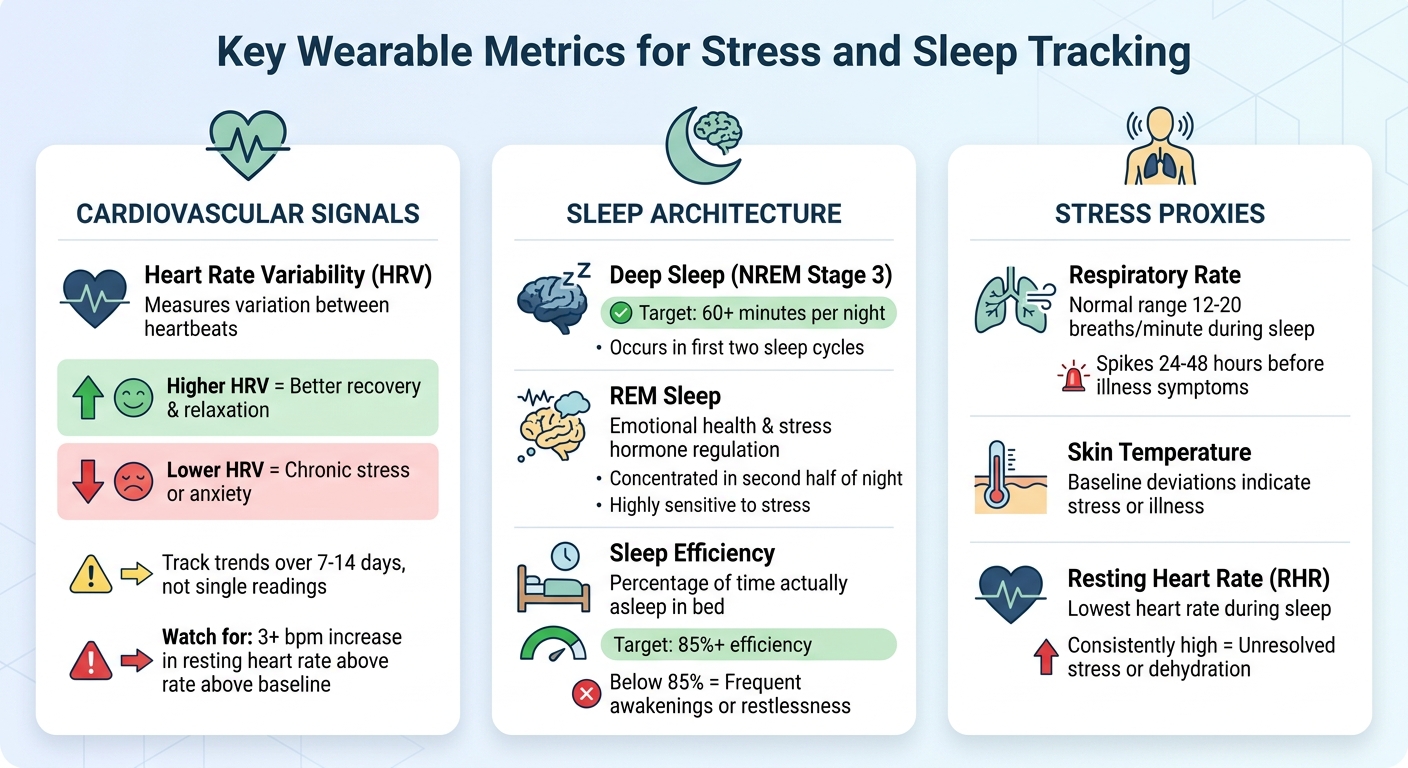
Key Wearable Metrics for Stress and Sleep Tracking
Wearables capture essential physiological data - like heart activity, sleep patterns, and stress indicators - that provide a deeper understanding of your stress response and recovery. By consistently monitoring these metrics, you can uncover trends that guide meaningful adjustments to your lifestyle.
The most insightful data points fall into three main categories:
- Cardiovascular signals: Metrics such as heart rate variability (HRV) and resting heart rate offer a glimpse into your stress and recovery balance.
- Sleep architecture: Details like deep sleep, REM sleep, and overall sleep efficiency provide clues about the quality of your rest.
- Stress proxies: Measurements like respiratory rate and skin temperature help identify stress levels and potential health issues.
Tracking these over time - rather than focusing on isolated readings - provides a clearer picture of your body's patterns and needs. For instance, if you feel tired despite getting eight hours of sleep, wearables can reveal whether poor deep sleep or elevated respiratory rates might be the cause.
Heart Rate Variability (HRV) and Stress Recovery
HRV measures the variation in time between your heartbeats, offering a direct look at how your autonomic nervous system is functioning. This system controls your stress responses and recovery processes.
"Heart rate variability (HRV) is one measurement that is widely collected by and can be extracted from wearables... a biological marker that provides an indirect assessment of autonomic nervous system function since the interplay between the sympathetic and parasympathetic systems influences heart rate." - Nature Scientific Data [3]
Higher HRV indicates better recovery and increased parasympathetic activity, which is linked to relaxation. On the other hand, lower HRV often signals that your body is stuck in "fight-or-flight" mode, commonly associated with chronic stress, anxiety, or even depression [3][6].
Tracking your overnight HRV curve can show whether your body is recovering during sleep. Ideally, HRV should rise during deep sleep in the first half of the night and stabilize or slightly decrease in the second half [6]. A flat or declining curve suggests incomplete recovery, meaning your nervous system isn't fully shifting into a restorative state.
A study conducted by KAIST analyzed 33,600 hours of data from 49 individuals using Samsung Galaxy Active 2 smartwatches. The results confirmed that consumer wearables could reliably track HRV metrics like SDNN and RMSSD, correlating them with sleep diaries and mental health scores [3]. This proves that even non-clinical devices can provide valuable insights into stress and recovery.
When analyzing HRV, focus on trends over 7–14 days rather than nightly fluctuations. A single low reading might be due to a tough workout or a stressful day, but a consistent downward trend signals a hidden stressor - whether it's overtraining, illness, or emotional strain [6]. Similarly, a resting heart rate that’s elevated by just 3 beats per minute above your baseline can indicate unresolved stress or early signs of illness [6].
Sleep Stages and Sleep Efficiency
Sleep is more than just "time in bed." Your brain cycles through various stages, each with specific roles in physical and emotional recovery. Wearables use tools like photoplethysmography (PPG), accelerometers, and skin temperature sensors to estimate these stages based on your body's signals [6].
- Deep sleep (NREM Stage 3): This phase is vital for physical recovery, hormone release, and clearing waste from the brain. It typically occurs in the first two sleep cycles. If you’re consistently getting less than 60 minutes of deep sleep, it’s a sign your recovery is compromised [6].
- REM sleep: This stage supports emotional health, creative thinking, and stress hormone regulation. Unlike deep sleep, REM sleep is more concentrated in the second half of the night and is highly sensitive to stress and disruptions [6].
- Sleep efficiency: This measures the percentage of time you’re actually asleep while in bed. A score below 85% suggests frequent awakenings or restlessness, which could point to stress, environmental factors, or sleep disorders [6].
The RESTORE Study by the University of Oxford (2024–2026) used wearables to track changes in sleep stages among participants undergoing Sleep Restriction Therapy. The study found that machine learning models could improve accuracy in detecting light and deep sleep stages, highlighting wearables' ability to monitor sleep trends over time [4].
While wearables aren’t as precise as polysomnography (PSG), the gold standard for sleep studies, they excel at identifying patterns over weeks. This broader view captures how your sleep responds to daily stress and lifestyle changes, which is often more actionable than a one-night snapshot [6].
Cortisol Proxies and Stress Monitoring
Although wearables can’t directly measure cortisol levels, they track related signals that act as indirect indicators of stress hormone fluctuations.
- Respiratory rate: A normal range during sleep is 12–20 breaths per minute. Spikes often occur 24–48 hours before illness symptoms appear, making respiratory rate a helpful early warning sign [6].
- Skin temperature: Deviations from your baseline can indicate stress or the onset of illness, even before you feel sick [6].
- Resting heart rate (RHR): This is your lowest heart rate during sleep. Consistently high RHR readings suggest unresolved stress, dehydration, or early signs of illness [6].
Together, these metrics provide a fuller picture of how stress impacts your body. For instance, if you frequently wake around 3–4 AM, check your HRV and heart rate data. This timing often aligns with your body’s natural cortisol rise, which can be exacerbated by stressors like alcohol metabolism or blood sugar dips [6]. These insights allow you to pinpoint specific triggers and take targeted action.
sbb-itb-f5765c6
Analyzing Long-Term Data for Patterns and Trends
Gathering data from wearables is just the starting point. The true advantage lies in analyzing this data to uncover patterns that show how stress and sleep interact over weeks or months. Spotting these trends can help identify potential issues before they escalate into long-term problems.
Time-Series Data Processing
To extract meaningful insights, wearable data must first be cleaned and prepped. Raw data often comes with gaps, noise, and inconsistencies that can skew results, so cleaning is a critical step.
One effective method for filling gaps is average day imputation. This involves using data from the same time period within a 7-day window (three days before and three days after the missing segment). Additionally, identifying non-wear periods with algorithms - such as Choi, Troiano, and van Hees - ensures the data remains accurate [2]. Among these, the van Hees algorithm, which uses raw accelerometer data, often delivers more reliable results compared to older methods that rely on simplified "count" data [2].
Once cleaned, the next step is segmentation. For short-term metrics like HRV (heart rate variability), use 5-minute intervals. For longer-term trends, aggregate the data hourly or daily [3][5]. This type of aggregation helps reveal whether your body is maintaining steady rhythms or showing signs of disruption, which can point to stress or poor recovery.
With clean, segmented, and aggregated data, you can begin to explore the deeper connections between stress and sleep.
Identifying Stress-Sleep Relationships
Analyzing long-term data allows you to uncover how stress and sleep influence each other. These connections often aren’t apparent from a single night’s data but become clear over time.
Look for deviations from your baseline. Individual differences account for over 80% of the variation in metrics like resting heart rate, HRV, and respiratory rate [8]. What matters most is how your numbers change relative to your personal baseline. For instance, a resting heart rate increase of just 3 beats per minute above your usual level could indicate unresolved stress or even early signs of illness [8].
Research from the University of Vermont highlights these relationships. Among college students, every additional hour of sleep reduced the odds of experiencing moderate-to-high stress by 38.3% [8]. On the flip side, an increase of just 1 beat per minute in resting heart rate raised stress odds by 3.6%, while a 1 breath per minute increase in respiratory rate was linked to a 23% rise in stress odds [8]. These patterns only emerge with consistent tracking over weeks.
"Changes in stress are visible [in sleep data]. The study showed that sleep measures from the Oura ring were predictive of participants' perceived level of stress." - Laura Bloomfield, Research Assistant Professor of Mathematics and Statistics, University of Vermont [9]
Monitor state transitions, not just averages. Advanced analysis now focuses on "sleep phenotypes", which are clusters of similar sleep characteristics that define your typical night. Tracking how often you shift from a "healthy" to a "fragmented" sleep phenotype can highlight stress events or health changes as they develop [7]. This dynamic approach provides far more insight into acute and chronic conditions compared to simply analyzing averages [7].
For a comprehensive view, examine your data through two perspectives: rhythms and routines [5]. Rhythms reveal whether your body maintains its natural cycles, while routines show whether your daily behaviors are steady or erratic. AI-driven health habit nudges can help stabilize these routines. Together, these insights offer a clearer picture of how stress is impacting your recovery.
How Healify Simplifies Long-Term Stress and Sleep Tracking
Dealing with raw data from wearables can feel overwhelming. Healify steps in to turn thousands of data points into clear, practical guidance you can actually use.
Real-Time Monitoring and Trend Reports
Healify takes the guesswork out of analyzing wearable data. By syncing directly with your devices, it automatically pulls in details like heart rate variability, sleep stages, and activity levels. Then, it transforms those charts and patterns into easy-to-understand insights you can act on [11].
One of its standout features is how it continuously processes data to show the relationship between your stress and recovery cycles [11][12]. For example, ever wonder, "Does exercising improve my sleep?" Healify can compare your sleep duration on active days versus more relaxed ones, giving you a clear, data-backed answer [11].
The system also keeps an eye out for changes in your personal baseline. If it notices something like an elevated resting heart rate that persists overnight, it can flag potential stress triggers - even before you feel the effects [12]. This kind of early warning system is crucial for spotting subtle, long-term trends in stress and sleep patterns. Plus, it helps you track whether you're meeting healthful activity levels, like the 5 kJ/kg/day higher energy expenditure linked to a 37% lower risk of premature mortality [11].
Anna: Your 24/7 AI Health Coach
Healify goes beyond just tracking data. Its AI coach, Anna, turns those insights into specific, actionable steps tailored to your needs. If your stress levels spike, Anna might suggest targeted interventions [13]. For instance, if your biometrics show high physical strain, she could recommend replenishing with electrolytes and eating 30g of protein within an hour to aid muscle recovery [13].
Your progress is reflected in a continuously updated Health Score, making it easy to see improvements over time. If your score drops by 7%, you'll get a notification explaining why and what you can do about it [13]. Beta testers love this feature. One user shared, "The first product that turns my wearable data into something I actually act on" [13].
"I used to feel overwhelmed by all the numbers on my iPhone and Apple Watch. Healify makes them make sense and gives me clear next steps." - Andrea, Beta Tester [13]
Anna also stays current by incorporating real-time web searches into her recommendations, ensuring they're aligned with the latest health guidelines [11]. The AI behind Anna is no slouch either, achieving 84% accuracy on numerical health questions and earning 83% favorable ratings for open-ended advice [11]. This makes her a dependable ally in managing long-term stress and sleep, helping you stay on top of your health with confidence and ease.
Using Data Insights to Improve Stress and Sleep
After gathering weeks or even months of wearable data, the real benefit lies in transforming those patterns into meaningful adjustments tailored to your body. By analyzing these trends, you can make targeted changes that enhance both your ability to manage stress and the quality of your sleep.
Using Benchmarks to Identify Intervention Points
Your personal baseline serves as a guide to detect when your metrics stray from the norm. Instead of stacking yourself up against population averages, focus on a rolling 30-day window to establish what’s typical for measurements like heart rate variability (HRV) and resting heart rate [6][15]. Keep in mind, factors like genetics and age play a role in shaping your individual benchmarks.
Certain red flags can indicate it’s time to take action. For example, if your resting heart rate climbs by 3+ beats per minute (bpm) above your baseline, it could signal stress, dehydration, or even the onset of illness. This would be a cue to prioritize recovery and hydration [6]. Similarly, if your deep sleep consistently drops below 60 minutes, it may be time to ease up on physical activity or refine your bedtime routine [6]. Sleep efficiency falling below 85% often points to issues like restlessness or trouble staying asleep, suggesting you should address environmental factors or adjust your evening habits [6][14].
The "traffic light" model offers a straightforward way to interpret your data:
- Green: Metrics are at baseline - proceed with regular training and routines.
- Yellow: One marker is slightly off, or you’re feeling mild strain - reduce intensity.
- Red: Multiple metrics have been off for two or more days - prioritize rest and recovery [16].
As HRV researcher Marco Altini advises:
"Don't chase a higher HRV, focus on a stable or higher-than-normal trend" [15].
Once you identify areas needing attention, the next step is to track how your adjustments influence your long-term trends.
Measuring Progress Over Time
When you make changes, it’s essential to evaluate their impact. Use the "one lever" rule to avoid confusion: start with a 14-day baseline, pinpoint one key habit (like cutting out late-night meals or alcohol), and adjust it for four weeks to observe the results [15]. This focused approach removes guesswork and helps you pinpoint what’s making a difference.
For instance, drinking alcohol in the evening can lower nightly HRV by around 16% and reduce deep sleep by 5% [15]. If you skip alcohol for a month and notice these metrics stabilize, you’ve identified a clear link. Similarly, practicing slow diaphragmatic breathing - about six breaths per minute for 5 to 10 minutes daily - can lead to measurable improvements in next-morning HRV [15]. By monitoring changes over 7-to-14-day intervals, you can filter out daily fluctuations and identify meaningful trends [6][15].
Conclusion
The real strength of wearable data lies in its ability to uncover patterns over time, rather than relying on isolated readings. By tracking factors like stress and sleep consistently, you can see how your body reacts to habits, seasons, and life events. This kind of ongoing monitoring picks up on details that one-time assessments often miss - like variations in sleep from night to night [17] or meaningful changes in physiological markers that signal when action might be needed [10]. These patterns help pinpoint the best times for intervention.
Take the University of Vermont's LEMURS study as an example. Researchers followed 525 first-year college students using Oura rings and discovered that every additional hour of sleep reduced the chances of moderate-to-high stress by 38.3% [8][9]. As Dr. Bloomfield explained:
"If we are able to identify in real-time that someone is experiencing increased stress, there might be an opportunity to offer helpful interventions. The first step is understanding the connection between sleep measures and mental health measures." [9]
Healify takes this concept further by turning raw data into actionable insights. Its AI health coach, Anna, reviews your wearables, biometrics, and lifestyle trends to provide clear, personalized guidance. Instead of overwhelming you with complex charts, it offers simple, practical advice - like when to push forward or when to rest - making your health data easy to act on.
Research shows that irregular sleep patterns can increase the risk of obesity, high blood pressure, and major depressive disorder [1]. By consistently monitoring your data and acting on its insights, you can strengthen your resilience, ward off chronic conditions, and take charge of your health for the long term. This ongoing feedback loop empowers you to make informed decisions and stay in control of your well-being.
FAQs
How long should I track before my stress-sleep patterns become clear?
Tracking stress and sleep over the course of a year can uncover the most valuable insights. While short-term monitoring - anywhere from 3 to 14 days - might highlight some patterns, it's the long-term data that paints a clearer picture of your habits and trends as they evolve over time.
Which wearable metrics matter most for better sleep and lower stress?
The main wearable metrics to focus on for better sleep and stress management are heart rate variability (HRV), sleep stages (such as REM and deep sleep), sleep onset latency, and overall sleep efficiency. These measurements give you a clearer picture of your stress levels and sleep quality, making it easier to monitor and improve your overall well-being.
When should changes in HRV, resting heart rate, or breathing rate worry me?
Monitoring your heart rate variability (HRV), resting heart rate, and breathing rate can reveal a lot about your overall well-being. If these metrics show persistent shifts outside your usual range or continue trending downward, it might signal heightened stress or disruptions in your nervous system's balance. Keeping track of these patterns over time allows you to spot potential concerns early and make informed adjustments to improve stress levels and sleep quality.