
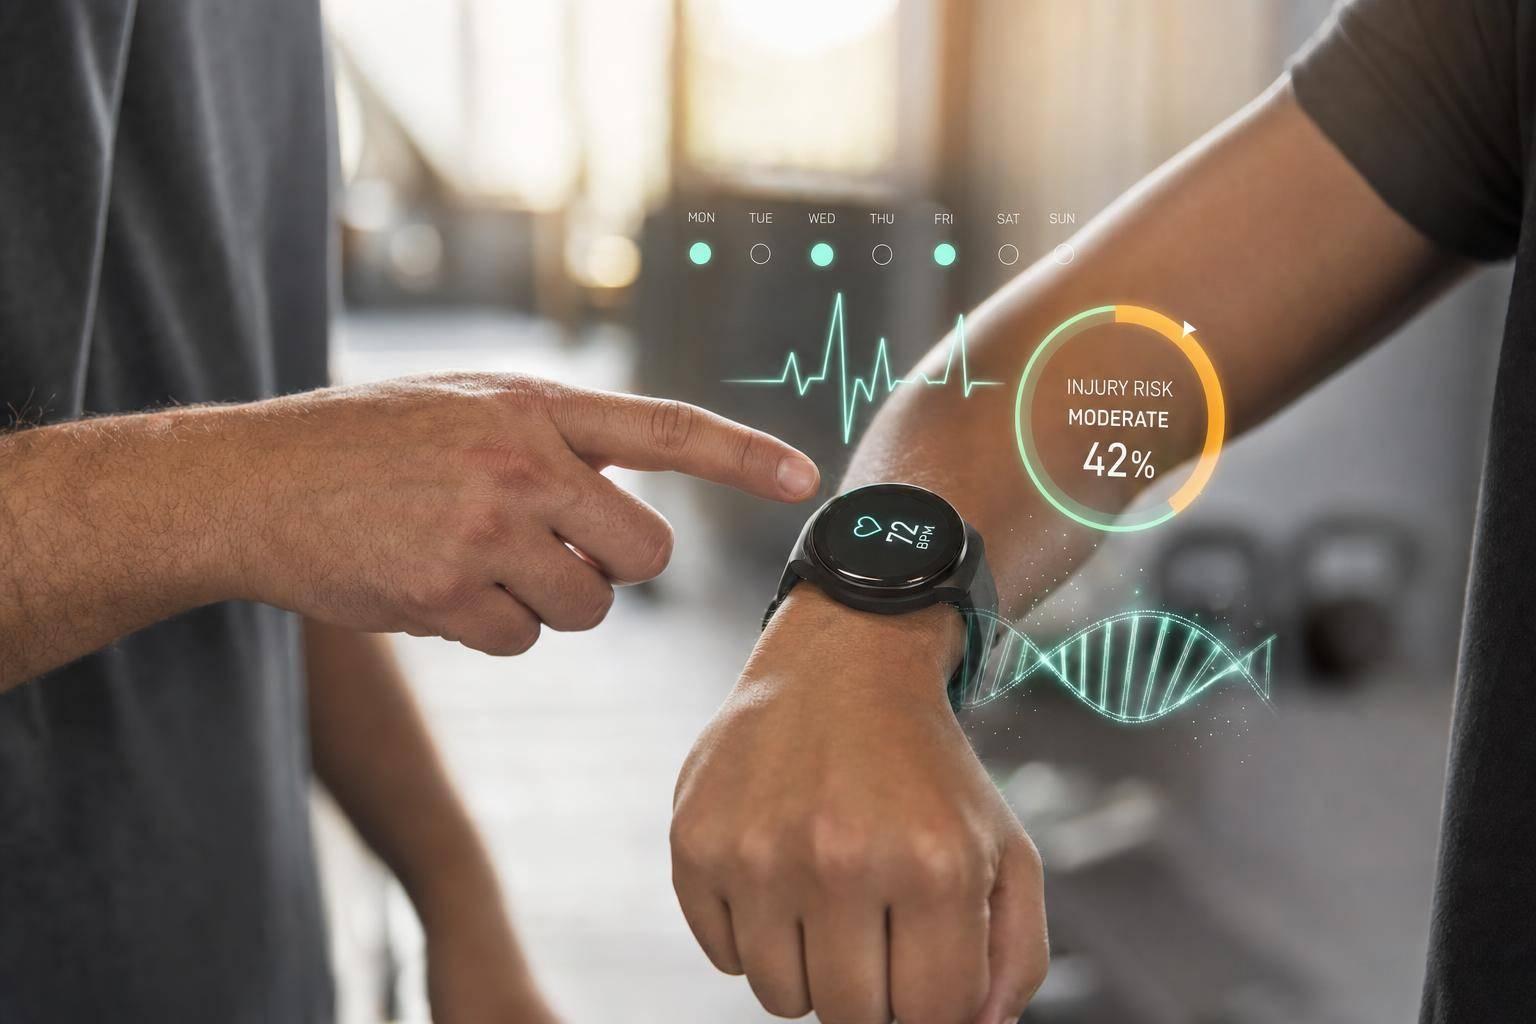
Injury risk is not about one gene or one bad workout. From what I see in this article, the main idea is simple: DNA gives you a baseline, but training load, sleep, fatigue, movement, and injury history decide how that baseline plays out day to day.
If I had to boil the whole piece down fast, I’d say this:
- Single-gene tests are weak on their own
- Polygenic scores are more useful than one SNP
- AI health coaching works best when it mixes genetics with live data
- Models like Random Forest, XGBoost, and LSTM can track risk over time
- Good injury prediction still needs human review, privacy rules, and bias checks
A few numbers stand out:
- A January 2026 runner study used 6,181 weekly samples from 142 athletes and hit an AUC of 0.784 when genetics, biomechanics, and training logs were combined
- One hybrid XGBoost-LSTM setup reached an AUC of 0.814 and flagged 72% of high-risk athletes
- In one intervention study, injury rates dropped from 11.2% to 6.1% when AI-driven nudges and actions were used
- A bone-density polygenic score was tied to 1.60x higher fracture odds in the highest low-BMD risk group
What matters most to me is this: genetics should be treated as one layer, not the answer. A person with a higher-risk profile may stay healthy with smart load management and sleep, while someone else gets hurt after fatigue, poor recovery, and a spike in workload stack up.
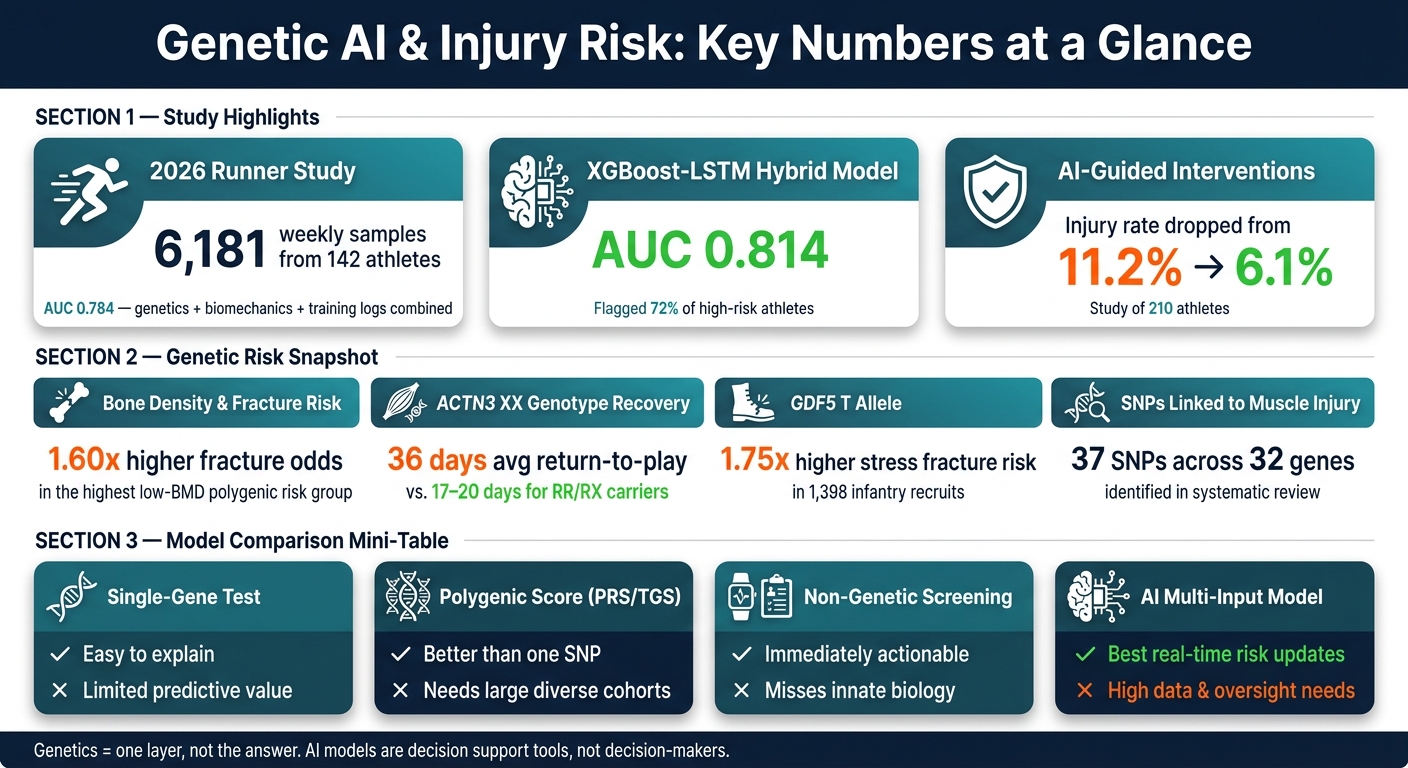
Genetic AI Injury Prediction: Key Stats & Model Performance
Quick comparison
| Approach | What it does | Main upside | Main limit |
|---|---|---|---|
| Single-gene test | Checks one variant like ACTN3 or COL5A1 | Easy to explain | Says little by itself |
| Polygenic score | Combines many variants into one score | Better than one SNP | Needs large, mixed validation groups |
| Non-genetic screening | Tracks load, sleep, movement, and history | Useful right away | Misses biology |
| AI multi-input model | Mixes DNA with live training and recovery data | Best at updating risk over time | Needs more data, setup, and oversight |
Bottom line: I’d treat these systems as decision support tools, not decision-makers. The article shows that the best use of genetic data is to help coaches, clinicians, and athletes make smarter calls before pain or missed time starts.
sbb-itb-f5765c6
What Genetic Data Can Tell Us About Injury Susceptibility
Some gene variants are linked to collagen, muscle force, tissue repair and breakdown, and bone healing. That can shift injury risk when training load is high and recovery is tight. The main point: one variant usually doesn't tell you much on its own. What matters more is the pattern across many variants.
Key Genes Linked to Tendon, Ligament, Muscle, and Bone Risk
The most studied variants tend to fall into a few pathways: collagen structure, muscle force production, tissue repair and breakdown, and bone integrity. These markers have been studied more than most, but each one has only a small effect by itself.
| Gene | Variant (SNP) | Primary Association | Key Finding |
|---|---|---|---|
| COL1A1 | rs1800012 | ACL rupture | TT was rare in rupture cases. [5] |
| COL5A1 | rs12722 | Achilles tendinopathy | CC appears protective; TT/TC raise risk. [5][6] |
| ACTN3 | rs1815739 | Non-contact muscle injury | XX linked to higher injury risk. [9] |
| GDF5 | rs143383 | Stress fractures | T allele raises stress-fracture risk. [5] |
| MMP3 | rs679620 | Tendon/ligament repair | AA linked to higher Achilles tendinopathy risk in some athletes. [5] |
| ACE | rs4341 (I/D) | Muscle damage | II linked to higher inflammation and CK. [6][8] |
In 46 elite FC Barcelona footballers, the COL5A1 rs12722 CC genotype was more common in female players with ACL ruptures. [5] In 1,398 infantry recruits, the GDF5 rs143383 T allele raised stress-fracture risk 1.75-fold. [5]
How These Variants Affect Tissue Strength, Repair, and Inflammation
COL1A1 and COL5A1 help build the collagen fibrils that give tendons and ligaments their tensile strength. Variants in these genes can change fibril diameter and organization. In plain English, that can affect how much load the tissue can handle before problems start.
ACTN3 works in a different way. It encodes α-actinin-3, a protein that anchors actin filaments in fast-twitch muscle fibers. If someone has the XX genotype and produces no α-actinin-3, the muscle may be less able to absorb and transfer force during explosive actions like sprinting, cutting, or jumping.
That difference can show up in recovery too. In one study, professional football players with the XX genotype averaged 36 days to return to competition after a muscle injury, compared with 17–20 days for RR or RX carriers. [6]
MMP3 is involved in tissue repair and breakdown. Higher-activity variants may slow repair and weaken tissue over time, which can leave tendons more open to chronic injury.
Why Single-Gene Results Are Not Enough
These markers can help explain susceptibility, but they do not determine outcomes. Single-gene tests have limited predictive value.
Injury susceptibility is polygenic, which means many variants act together rather than one switch turning on or off. [6][8] A systematic review found 37 SNPs across 32 genes linked to muscle injury alone, and the evidence for most of them is still inconsistent. [8] Results also differ across populations, so one marker that looks useful in one group may not carry over well to another. [7]
This is where genetic data starts to become more useful. Instead of looking at one SNP in isolation, newer models combine many variants into polygenic risk or total genotype scores, then pair that with training load, movement patterns, and recovery data. That's a much more grounded way to think about injury risk.
From DNA Variants to Usable Risk Scores
Raw genetic data - a list of SNPs - is just that: a list. It starts to matter only when those variants are turned into a risk score. So the core issue isn't whether one variant matters on its own. It's how to combine many variants into one signal that people can actually use.
Polygenic Risk Scores and Total Genotype Scores Explained
Researchers usually roll genetic data into a single number in two main ways. A Total Genotype Score (TGS) adds up selected risk or protective alleles. A Polygenic Risk Score (PRS) does more math: it weights hundreds or thousands of SNPs based on effect sizes from GWAS, so variants with stronger links carry more weight.[4]
That matters because genetics accounts for 50% to 85% of the variance in bone mineral density (BMD), which is a major predictor of stress fractures. People in the highest low-BMD risk group also have 1.60x higher fracture odds.[4]
Still, there’s a catch. PRS and TGS both need large, diverse validation cohorts, and many current studies are too small to generalize well.[10][1]
On their own, these scores are only part of the picture. They become far more useful when paired with training, recovery, and movement data.
Combining Genetic Profiles With Load, Movement, and Recovery Data
Genetic scores work best as a baseline layer - a snapshot of someone’s built-in susceptibility. But susceptibility by itself doesn’t cause injury. In most cases, injury shows up when that predisposition meets workload spikes, poor sleep, and stacked fatigue.
In practice, researchers build injury-focused profiles by grouping SNPs into pathways like collagen integrity, inflammation response, and bone density. That genetic profile is then treated as a fixed input. On top of it, they layer dynamic inputs such as training load, movement and biomechanical markers, prior injury history, and sleep quality.[2]
A January 2026 study published in npj Digital Medicine followed 142 competitive endurance runners over 12 months and collected 6,181 weekly data samples. When researchers combined SNPs with biomechanical data and training logs, a Random Forest model reached an AUC of 0.784 and beat traditional logistic regression.[10] That’s the kind of setup AI can use to update risk over time.
Comparison Table: Single-Gene Tests vs. Polygenic Scores vs. Non-Genetic Screening
| Approach | What It Measures | Strengths | Weaknesses |
|---|---|---|---|
| Single-Gene Tests | Specific variants such as ACTN3 or COL5A1 | Clear biological insight for specific tissues | Explains little of total injury variance |
| Polygenic Scores (PRS/TGS) | Aggregate effect of many SNPs across the genome | Better predictive power for complex, polygenic traits like injury risk | Requires large, diverse cohorts for validation; complex to interpret |
| Non-Genetic Screening | Workload, sleep, movement, and history | Real-time, dynamic, and immediately actionable | Ignores innate biological susceptibility |
| Multifactorial AI Models | DNA plus load, movement, and recovery data | Most predictive; captures how load, fatigue, and genetics interact | High data and computational requirements |
AI starts to pull its weight when it updates these fixed scores with live load, movement, and recovery data. From there, machine-learning models can turn static genetic inputs into live injury-risk estimates.
How AI Improves Injury Prediction and Prevention
Once genetic scores are set, AI blends them with live training signals to refresh injury risk day by day. In plain English, it takes a fixed baseline from genetics and combines it with what’s happening right now in training and recovery.
Machine Learning Models Used in Injury Risk Prediction
Different models do different jobs.
Logistic regression works best for simple, easy-to-read binary injury classification. Random Forest does well with noisy data and lots of variables. XGBoost handles high-dimensional, non-linear inputs. And LSTM models fatigue over time, which matters because injury risk usually builds rather than appearing out of nowhere.
One setup stands out: a hybrid XGBoost-LSTM model. It uses XGBoost for static inputs and LSTM for workload sequences. In one study, that model reached an AUC of 0.814 and flagged 72% of high-risk athletes [2]. That setup is built to track how fatigue stacks up before injury shows up [2].
Data Pipelines, Feature Importance, and Real-Time Monitoring
The pipeline begins by pulling data from several sources: cheek swabs, wearables, GPS load logs, strength tests, and stress scores [2]. Genetics act as the fixed layer. Load and recovery data act as the changing layer. From there, inputs are split into static and dynamic features, cleaned on separate tracks, and then merged.
Feature engineering helps sort out which signals matter most. PCA and Lasso reduce noise. SHAP (SHapley Additive Explanations) shows how specific inputs - such as a COL5A1 variant or a spike in the acute:chronic workload ratio - push a risk score up or down on a given day [2][10]. That matters because a model people can read is far more useful than one that spits out a score with no explanation.
One helpful output from this kind of analysis is a sleep-fatigue synergy index. It tracks the non-linear jump in injury risk when poor sleep and high fatigue hit at the same time [2].
Real-time monitoring can also cut injury rates. In a study of 210 athletes, AI-guided stratified interventions reduced injuries from 11.2% to 6.1% [2]. The right model still depends on the setting and the data on hand.
Comparison Table: Classic Statistics vs. Machine Learning vs. Deep Learning
| Feature | Classic Statistics (e.g., Logistic Regression) | Machine Learning (e.g., Random Forest, XGBoost) | Deep Learning (e.g., LSTM, Neural Networks) |
|---|---|---|---|
| Interpretability | High; easy to see how each variable affects the outcome | Moderate; feature importance tools like SHAP can help explain outputs | Low; complex black-box structures often need explainable AI |
| Data Requirements | Low to moderate; works best with smaller datasets | Moderate; needs enough samples to capture non-linear patterns | High; typically requires very large labeled datasets and significant compute |
| Genetic Data Handling | Good for direct correlations, but limited with gene-gene interactions | Strong at capturing SNP-environment interactions | Strong potential for multi-omics and hierarchical, non-linear genotype-phenotype patterns |
| Real-Time Use | Best for simple, static risk scores | Well-suited for daily workload and injury prediction | Emerging; computational cost can limit real-time deployment |
| Typical Injury Use Case | Single-gene association studies | Predicting injury risk from tabular data such as age, weight, and prior injury | Real-time monitoring and complex multi-omics integration |
The best choice comes down to three things: dataset size, how fast the model needs to update, and how much explanation the user needs. Those tradeoffs shape where each approach fits best across sports, fitness, and workplace use.
Use Cases, Ethics, and What Comes Next
Where These Models Are Being Applied Today
These models are no longer stuck in lab papers. They’re already showing up in elite sports, everyday fitness, and occupational health. The big change now is simple: the focus has shifted from building the model to using it in practice.
In January 2023, the Los Angeles Football Club (LAFC) partnered with 3X4 Genetics to roll out "Genefit", an AI software system that reviews physiological data and genetics to predict injuries [12]. It blends genetics with sleep and heart-rate data to help shape training and recovery [12].
In February 2026, FC Barcelona brought in a centralized biomedical platform built with Genomcore and an intelligence layer from Made of Genes. The goal was to issue "orange flags" before injury by combining genetic and metabolomic data in one system [13]. That same month, USA Hockey started digitizing claims data for 1.2 million members, using AI to spot age- and play-phase patterns and send safety insights back to coaches and manufacturers [13].
For recreational users, Healify pulls together wearables, biometrics, bloodwork, and lifestyle data to deliver personalized guidance.
Comparison Table: Use Cases Across Sports, Fitness, and Work
The table below shows how the data, outputs, and actions shift depending on the setting.
| Use Case | Typical Data Sources | AI Outputs | Modifiable Risk Factors | Practical Interventions |
|---|---|---|---|---|
| Elite Sports | DNA (ACTN3, COL5A1), GPS, Oura, Firstbeat | Injury "Orange Flags", daily readiness scores | Training load, sleep, fatigue | Adjusted practice intensity, personalized recovery protocols |
| Occupational Health | Biometrics, movement screens, age, injury history | Fatigue alerts, ergonomic risk scores | Repetitive strain, posture, recovery time | Mandatory rest breaks, workstation adjustments, targeted strength training |
| Recreational Fitness | Direct-to-consumer DNA kits, wearables | Longevity insights, personalized risk scores | Overtraining, nutrition, sleep quality | Personalized workout plans, recovery and training guidance via Healify |
Conclusion: Key Limits, Benefits, and Safeguards
These use cases only work when genetic data stays tied to live monitoring and human judgment.
The strongest results come when genetics is treated as one layer of the picture, not the full answer. In one study of professional football players, those with a Total Genotype Score below 56.2 a.u. had an odds ratio of 3.5 for muscle injury compared with higher-scoring peers [11]. But that signal becomes useful only when paired with live load and recovery data.
Privacy and bias can’t be treated as side issues. In LAFC’s partnership with 3X4 Genetics, both the club’s legal team and the Players Union had to review the setup, and genetic data could not be used for contract decisions or employment discrimination [12]. For any group handling this kind of data, practical starting points include synthetic data augmentation, federated learning, triple-encryption, and strict access controls.
There’s also a data gap that matters. Many genetic studies still focus on specific ethnic cohorts, which means a model trained on one population may not work well in another. That’s why external validation across diverse ancestry groups and sexes is a must. As Alen Juginović from Harvard Medical School's Department of Neurobiology put it:
"Ethical concerns regarding privacy, discrimination, and data misuse necessitate clear guidelines." [3]
Predictive accuracy gets better only when privacy, bias controls, and human oversight are built in from day one. AI should remain decision support: a risk score can prompt action, but clinicians and coaches make the call.
FAQs
How accurate are AI injury risk models?
AI-powered injury risk models look promising, but their accuracy can change a lot depending on the data, the sample, and the method behind the model.
Some studies show very high accuracy in specific collegiate datasets. But when you look at broader clinical analyses, the picture is more mixed, with a pooled sensitivity of 0.79.
One pattern shows up again and again: these models usually work best when they pull from more than one type of data. That can include:
- Genetic markers
- Biomechanics
- Training workloads
That makes sense. Injury risk isn’t driven by one thing alone. It’s more like a stack of small signals, and models tend to do better when they read several of those signals together instead of leaning on a single input.
Can genetic risk be lowered with training and recovery?
Yes. Genetic risk factors can be reduced with training and recovery changes that fit the person.
Genes may affect how likely someone is to get hurt. But that doesn’t mean the outcome is fixed. When you combine genetic insights with wearable data and biomechanical data, you can make smarter calls about training load, nutrition, and recovery.
That’s where Healify comes in. It takes that input and turns it into a clear, personal action plan.
What privacy risks come with using genetic data?
Genetic data comes with privacy risks that are hard to ignore. Unlike a password, you can't change your DNA. It's permanent, passed through families, and it can reveal deeply personal details about relatives who never agreed to take a test in the first place.
There's another problem too: data labeled as anonymized may not stay anonymous forever. In some cases, it can be linked back to a person, or used in research or commercial projects without clear permission. Because genomic data is so sensitive, it needs strong security to block unauthorized access and reduce the risk of discrimination.